Last year, I found myself bored during one of the many Covid lockdowns. This led me to creating a somewhat complete ranking of all the coasters I’ve ridden (I say somewhat: I ignored very small family and kiddie creds). But then I asked myself: are there any trends here?
I went down a bit of a rabbit hole and ended up answering that question, and the answers (plus some scary maths) follow. Don’t worry, you can skip the scary maths bit though.
Before getting started, you can see my Top 10 here. And when I ranked all these coasters, I went for broadly the same logic of ‘Out of all these coasters, which one would I like to ride most?’. It gets a bit iffy mid-way through; for example, how do you compare a specific Vekoma looper, Maurer spinner and a woodie all from different countries (an some you haven’t ridden in years) and decide what you’d rather ride? The short answer is you basically just wing it and hope for the best..!
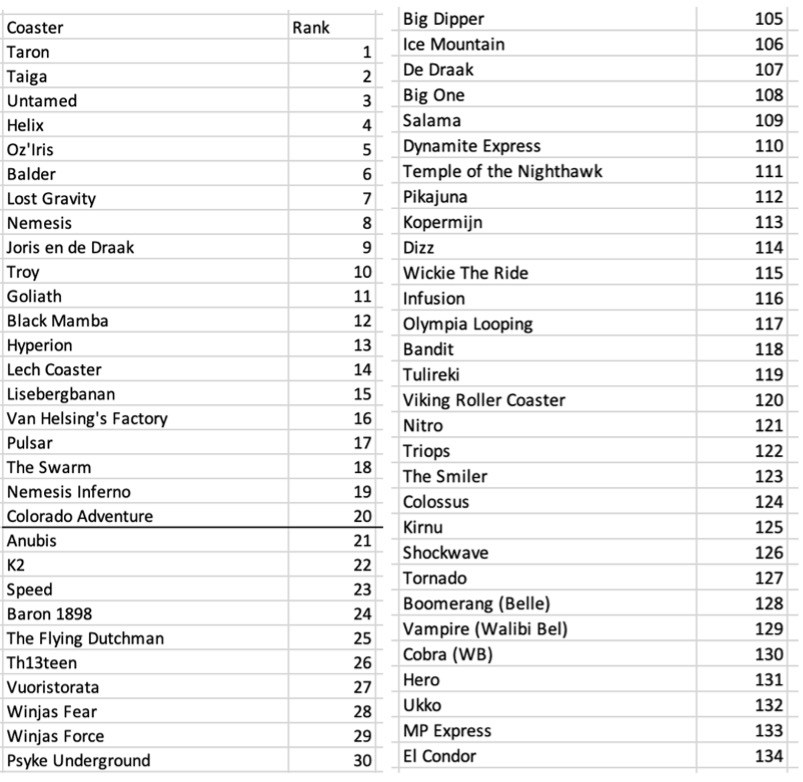
I specifically wanted to look at 4 key ride stats from each coaster: length, height, speed, inversions. Fortunately I‘ve tracked all these things in the past, mostly using rcdb, unless I think it’s wrong…Untamed’s 270 Double Inverting Corner Stall is 2 inversions, not 1 thank you very much. So far so good.
*Now for some scary-ish maths…*
Now trying to come up with a correlation between several different things is…tricky. Fortunately during my PhD I had to self-teach myself how to use a statistical programming language, R (who says that a Maths PhD doesn’t have real world applications?!). Basically what this would let me do is put in all the data I had, and it would spit out all the possible correlation details I could want. The downside is that I needed complete data for each ride; so the length, height, speed and number of inversions. A fair few had incomplete data, meaning I’d be looking at 110 different coasters and their stats. That leaves a few gaps, but largely it’s okay.
So, putting all that data in and running some magic stats stuff that I don’t really understand properly, I got this lovely graphic:
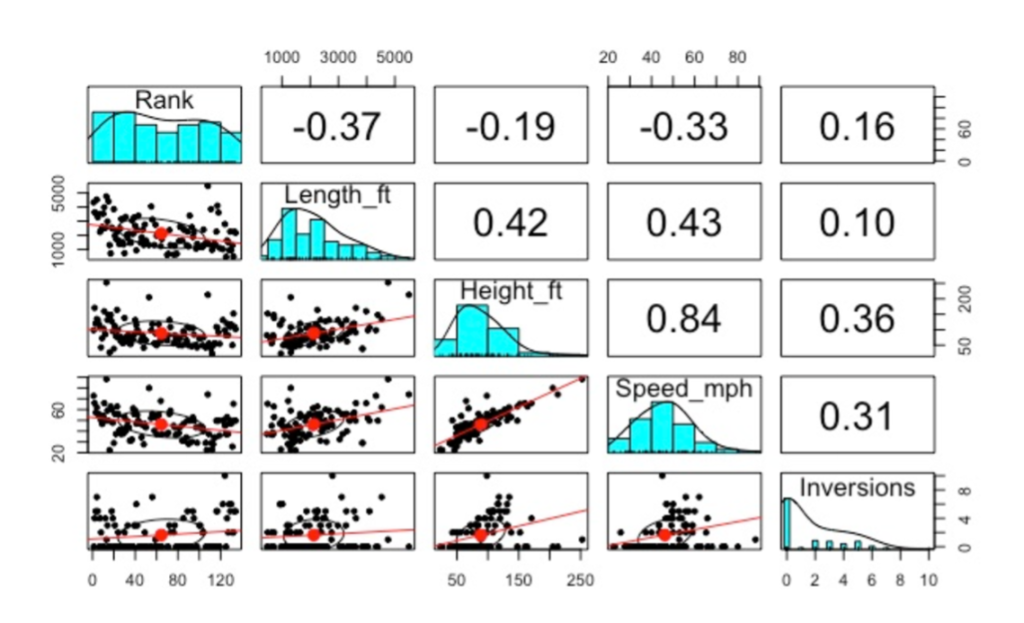
This shows individual correlation between Ranking and each stat, as well as between the stats themselves. The closer the number is to +1, the better the correlation. The closer the number is to -1, the better the “anti-correlation” (basically, the higher the value of the independent variable, the lower the dependent variable). It also gives plots against each variable. So on these individual cases, it seems:
-The longer the length of the cred, the less likely I am to rate it.
-The height of the cred doesn’t matter too much, but I seem to prefer slightly shorter creds
-Creds with higher speeds might detract from the experience for me.
-Number of inversions doesn’t matter too much, but some might help.
Interestingly, these vague interpretations don’t necessarily match up with my experiences. These are indeed just possible thoughts.
And that’s almost the point: there’s issues with this, of course. Most of the creds in this list are in very short range of height (about 80-120ft), and speed (around 40-50mph). This makes it hard to get a good view of any correlations. Equally, number of inversions is a difficult one given its discrete data (0, 1, 2, etc) rather than continuous, and a huge proportion of these creds have no inversions.
But what about combining all these together? Well, R is able to calculate that (though I don’t *really* know how..), and gives a few different measures.
-The first is an adjusted R-squared number (like an R-squared number, but for multiple variables). The closer to 1, the better all the model explain the ranking. This was churned out to be 0.2266, which is low (but in these situations, ie – ones which are less scientific, lower numbers are to be expected).
-We then get a F-statistic value, and a p-value, which are related. The F-statistic’s ‘goodness’ is only seen when compared to another number which comes from the number of pieces of data you have, and the p-value effectively indicates the probability that the F-statistic’s value is wrong. Effectively you want a large F-statistic and a low p-value. The F-statistic is 8.984, which given the size of the data is good, and the p-value is 2.799*10^(-6), which is good.
(NB: I know very little about all this, so I could very much have been talking out my backside during this..)
*End of most of the scary maths stuff*
So basically, what this means is that the model I have (which can be put into an equation; see below) isn’t particularly good at predicting where I’d rank a coaster. But there exists something, perhaps a much more complicated formula, which might be good at such predictions! None of that is too surprising – I’m more likely to like a coaster with good stats after all. But obviously things like theming, location, manufacturer, restraints, etc all come into play too.
So, without further ado, the current formula I have…
Rank = 131.777733 – 0.010833*L + 0.254006*H – 1.607595*S + 4.531214*I
where: L = length in feet, H = height in feet, S = speed in mph, I = inversions
Side note: the stuff which is also churned out from the programming suggest that the current formula puts too much of an incorrect emphasis on height, and that number of inversions is problematic for the formula.
As a random example, using two rides from Cedar Point to show this, this would suggest something like:
Maverick (L=4450, H=105, S=70, I=2) could be my 6th favourite ride, but..
Steel Vengeance (L=5740, H=205, S=74, I=4) might only just squeeze into my Top 20.
Hmmm, maybe not…
Fun fact as well: this formula suggest that a “no-cred” (ie something with no length, height, speed or inversions) would be more fun than my bottom 3 coasters. Those are Ukko (Linnanmaki), as well as MP Express (Movie Park Germany) and Condor (Walibi Holland). Hard to disagree there..!
It’ll be interesting to revisit this after riding some new creds, and maybe redoing this whole thing after getting a lot more creds under my belt, to see if I get something which is perhaps better! And also it’d be great to add more into it to try and make it a bit more accurate (possibly)!
Do you rank your coasters ridden? Do you go for a Top 10? 25? ‘Top 10%”? Or keep track of any geeky extra things? I’d love to know!
